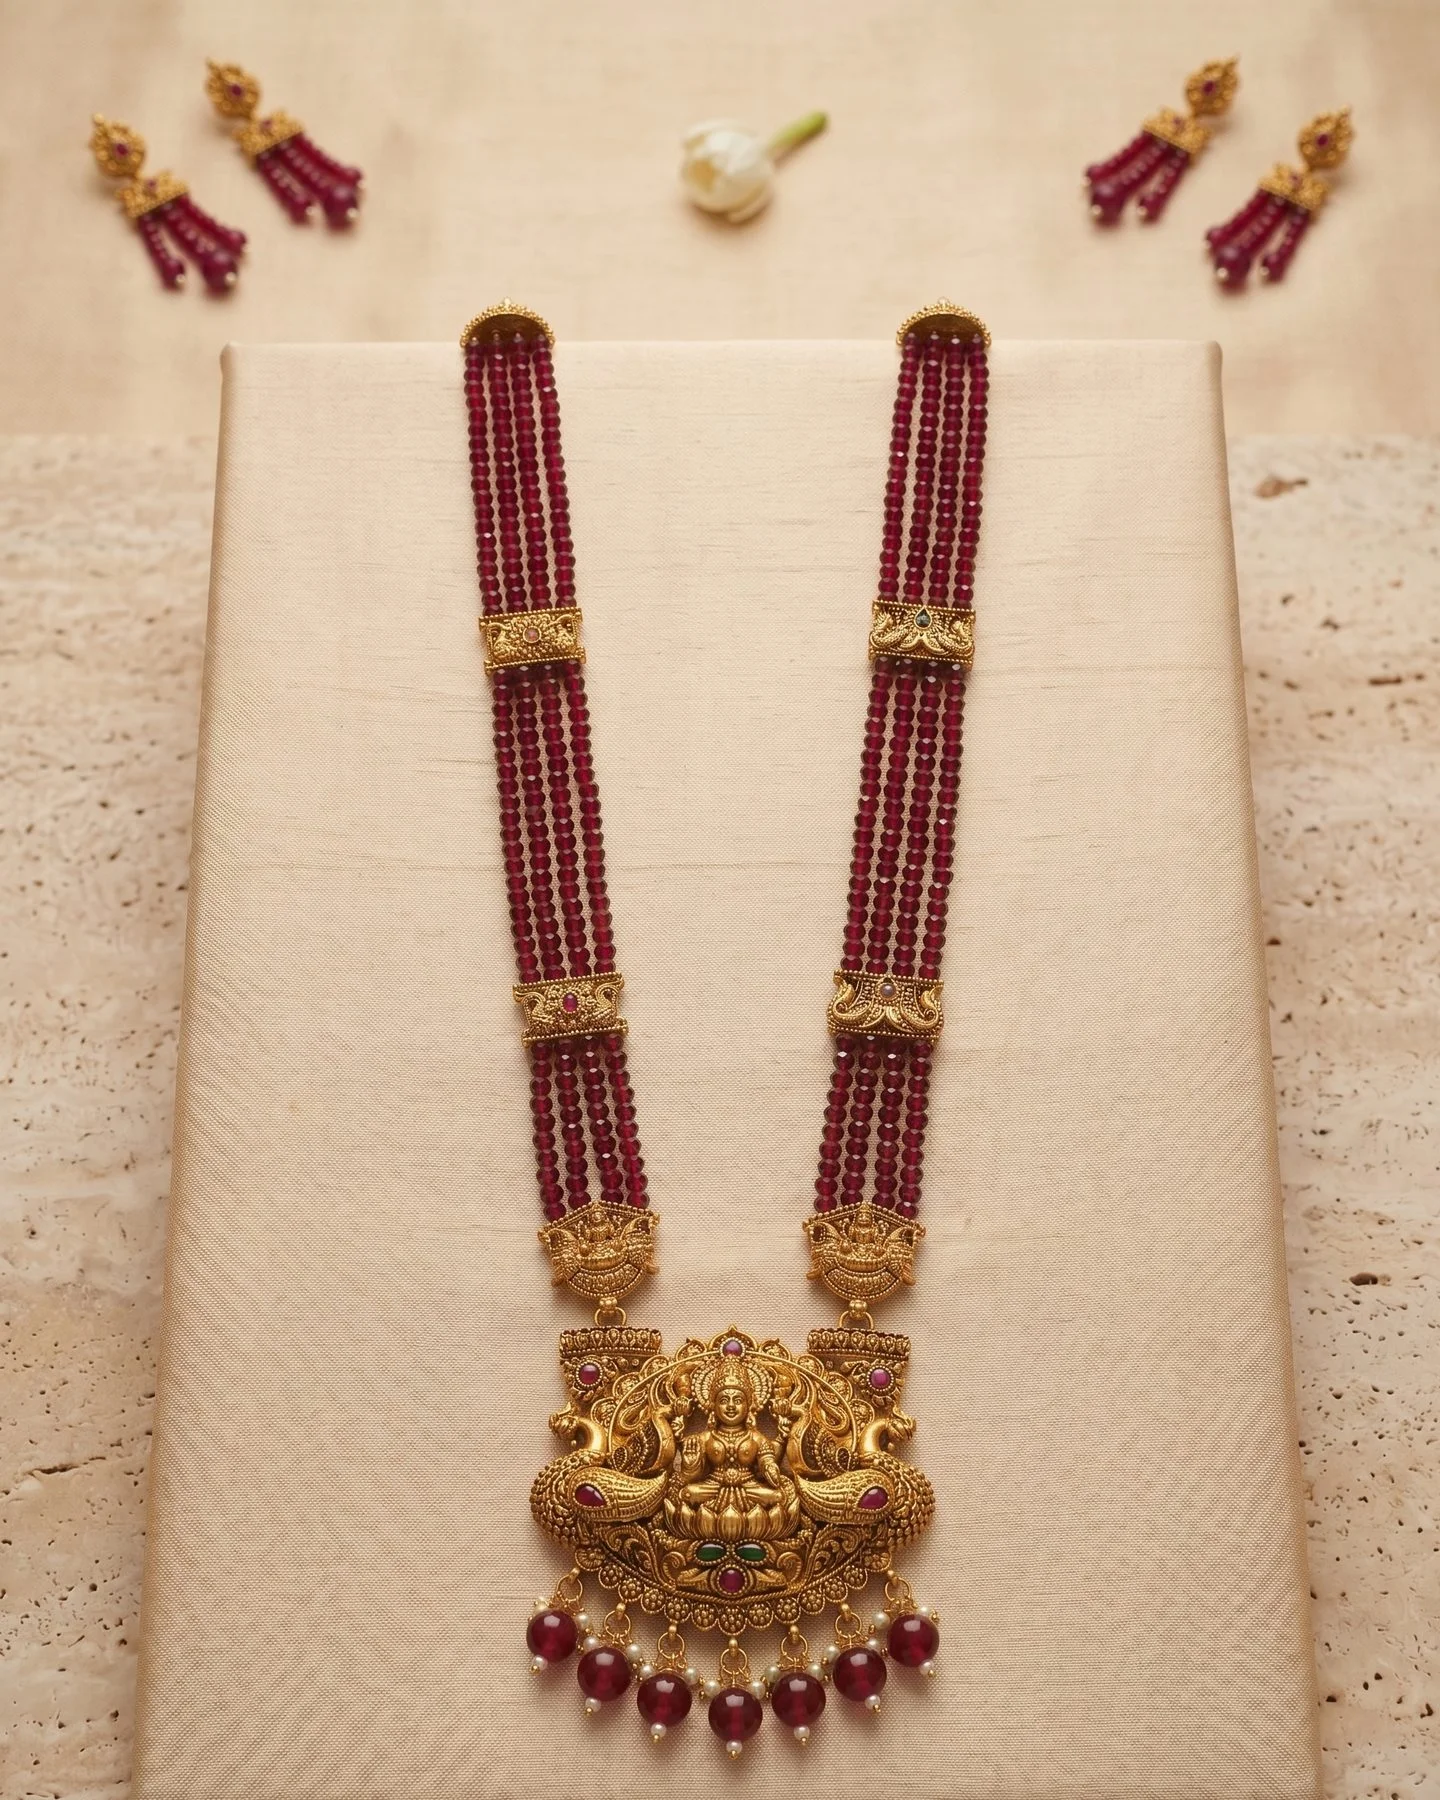
Most jewellery businesses have a feel for what sells. Data turns that feel into decisions. A simple monthly analysis tells you what to re-order, what to drop and what to try next.
Look for patterns
Group results by:
- Style: temple, Kundan, AD, oxidised
- Price tier: entry, core, premium
- Piece type: necklace set, earrings, bangles
- Colour: stone and finish colours
- Store or region
Patterns tell you what to order more of, even for new designs you have never stocked, not just which single designs worked.
Account for timing
A design that sold fast before Diwali may be slow afterwards, so compare designs in the same season. Keep last year's data to compare seasons: a design that sold well last Diwali is a strong candidate to repeat, possibly in a new colour.
Use it for orders
- Re-order bestsellers deeper
- Replace slow designs with variations of bestsellers
- Test new designs in small quantities
Common mistakes
Judging by one or two customer comments rather than numbers, or comparing designs across different seasons.
An example
A distributor finds that temple jhumkas in the core price tier sell out every month, while premium chokers sell slowly. Next season, they deepen jhumka orders, add two new jhumka designs, and reduce premium choker quantities.
See re-order planning.
Simple tools
A spreadsheet with one row per design code and columns for date received, quantity received, weekly sales, stock left, style and price tier is enough for most businesses; many billing systems can export sales by product. Update it weekly, add the sell-through and weeks-of-cover formulas, and sort by them. It takes minutes each week and turns ordering from guesswork into a routine.
Qualitative feedback
Numbers show what sold; retailers and staff tell you why. Ask them which pieces customers tried on but did not buy, and why. That feedback often explains slow designs better than data alone.
A sell-through calculation, step by step
For each design, over a set period (for example four weeks):
Sell-through % = units sold / (units sold + units left) x 100
| Design | Received | Sold in 4 weeks | Left | Sell-through |
|---|---|---|---|---|
| JH-01 | 200 | 150 | 50 | 75% |
| NS-12 | 200 | 60 | 140 | 30% |
| PN-05 | 400 | 280 | 120 | 70% |
JH-01 and PN-05 are candidates for re-order; NS-12 needs re-merchandising or should not be re-ordered. Sell-through beats counting units sold, because it accounts for how much stock you had.
Combining sell-through with margin
A design that sells fast at a thin margin can earn less than one that sells a little slower at a good margin. Multiply units sold by profit per unit to see which designs earn the most, and use both measures when deciding what to re-order.
Weeks of cover
Weeks of cover = units left / average weekly sales. A design with 10 weeks of cover before a peak is healthy; one with 2 weeks needs a re-order now; one with 40 weeks is overstocked. Checking weeks of cover monthly keeps stock balanced.
Sharing data with your manufacturer
Share a simple summary with your manufacturer each season: your top ten designs by sell-through, the colours and finishes that sold best, and the ones that did not. Good factories use this to suggest new designs in the same direction and to plan production for your next order. It also helps them keep your best sellers available for quick re-orders. Read long-term supplier relationships.